Cutting Kafka Metric Cardinality by 97% Without Increasing Broker Memory
How we used the OpenTelemetry Collector to send about 190 of 6,450 series per Kafka broker to SigNoz, and caught a label collision that hid the difference between two clusters.
We wanted to monitor two Strimzi-managed Kafka clusters with OpenTelemetry. That meant answering six questions from our observability backend, SigNoz:
- Are all brokers up, and is the collector still scraping them?
- Which consumer groups are falling behind, and by how much?
- Are any partitions under-replicated or offline?
- Is there an active controller?
- Are produce and fetch requests getting slower?
- Are broker disks filling up?
The plan in the ticket named the OpenTelemetry Collector's jmx receiver for the broker-side questions. That receiver turned out not to exist in our collector. The replacement we chose exposed about 6,450 series per broker, and we store about 190. We also shipped a label bug that merged both clusters into one series, and caught it the same night.
This post covers the decisions, the config, and the numbers, including the parts we got wrong.
The setup
- Two Strimzi Kafka clusters,
orders-kafkaandwallet-kafka, in one Kubernetes namespace. Kafka 4.2.1 in KRaft combined mode (each node is both broker and controller), one node per cluster, replication factor 1. - Strimzi operator 1.1.0.
- OpenTelemetry Collector contrib 0.156.0, exporting to SigNoz v0.136.1.
- Each broker has a 1024Mi memory limit, and the busier one peaks at 85% of it. That last fact shaped most of our choices.
Here is where we ended up:
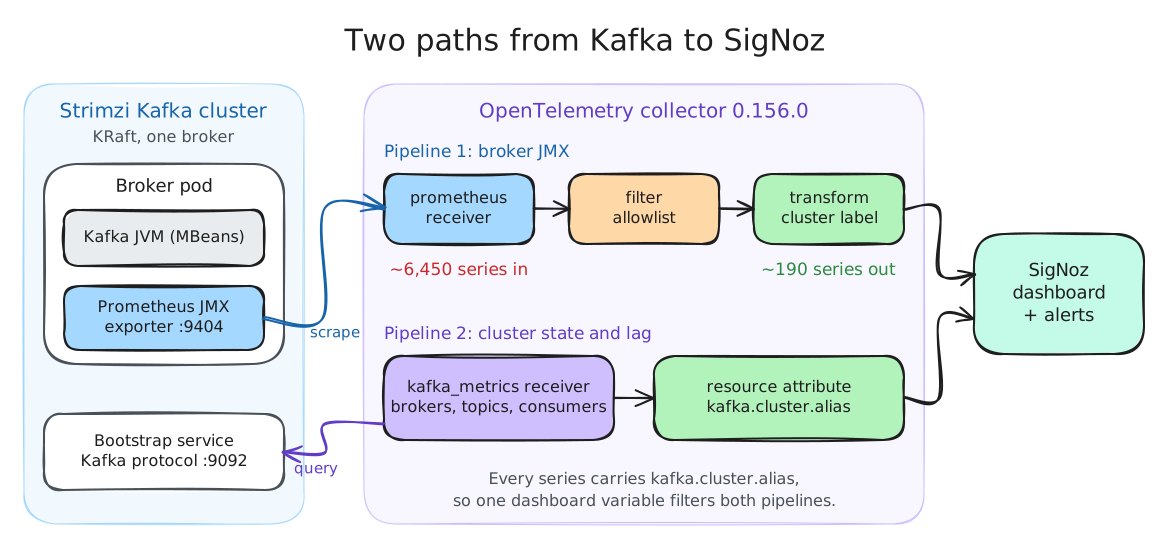
Two sources cover the six questions, plus one metric family we already had:
| Question | Source | Key metric |
|---|---|---|
| Brokers up | kafka_metrics receiver |
kafka.brokers |
| Consumer lag | kafka_metrics receiver |
kafka.consumer_group.lag_sum, members |
| Under-replicated or offline partitions | broker JMX | kafka_server_replicamanager_underreplicatedpartitions, kafka_controller_kafkacontroller_offlinepartitionscount |
| Active controller | broker JMX | kafka_controller_kafkacontroller_activecontrollercount |
| Request latency | broker JMX | kafka_network_requestmetrics_totaltimems |
| Disk | kubelet (already collected) | k8s.volume.available, k8s.volume.capacity |
The kafka_metrics receiver talks the Kafka protocol to the bootstrap service. It needs no broker changes, and it gives you broker count, topic and partition offsets, and consumer group lag. It cannot see offline partitions, the controller, or request latency. Those live only in the broker's JMX MBeans.
The JMX receiver isn't there anymore
The obvious way to read broker JMX from an OpenTelemetry collector used to be the jmx receiver. We looked for it in our build:
docker run --rm ghcr.io/open-telemetry/opentelemetry-collector-releases/opentelemetry-collector-contrib:0.156.0 components | grep -i jmxThat returned nothing. The receiver was deprecated on 2026-01-30 (contrib issue #45740). It ran the JMX scraper as a Java subprocess inside the collector, and the official collector images don't ship a Java runtime. The issue's plan was to drop it from the distributions first and delete the code later, which is why the source still existed at tag v0.156.0 while the binary no longer included it. If your docs or tickets still link to receiver/jmxreceiver on main, that link is a 404 now.
That left three ways to get broker JMX data:
| Option | How it works | Cost for us |
|---|---|---|
| OTel Java agent in the broker | Inject the agent and set OTEL_JMX_TARGET_SYSTEM for Kafka |
An earlier attempt estimated 100 to 150Mi of extra memory per broker. Our brokers had about 158Mi of headroom. |
| Standalone JMX scraper | A separate Java process reads remote JMX and sends OTLP | Another process to run, and remote JMX to open on every broker |
| Strimzi's Prometheus JMX exporter | Strimzi runs the exporter as a Java agent in the broker and serves /metrics on port 9404 |
One field on the Kafka resource. The collector scrapes it like any Prometheus target. |
We picked the Strimzi exporter. Strimzi supports it directly, it needs no remote JMX port, and the collector side is an ordinary Prometheus scrape.
Turning it on
The exporter needs a rules file in a ConfigMap. We copied Strimzi's example (examples/metrics/kafka-metrics.yaml at tag 1.1.0) unchanged, shared it between both clusters, and pointed each Kafka resource at it:
spec:
  kafka:
    metricsConfig:
      type: jmxPrometheusExporter
      valueFrom:
        configMapKeyRef:
          name: kafka-metrics
          key: kafka-metrics-config.yml
Changing metricsConfig makes Strimzi roll the brokers. With one broker per cluster, that is one to two minutes without Kafka for the apps on that cluster. We did the quieter cluster first, watched it for a while, then did the second.
The memory concern turned out to be unfounded:
| Broker | Peak working set before (24h) | After the exporter |
|---|---|---|
| wallet | 837Mi | 817 to 820Mi |
| orders | 866Mi | 857Mi |
The title's claim about broker memory rests on these two numbers. The collector pod went from 233Mi to 252Mi after it started scraping the exporter.
6,450 series per broker
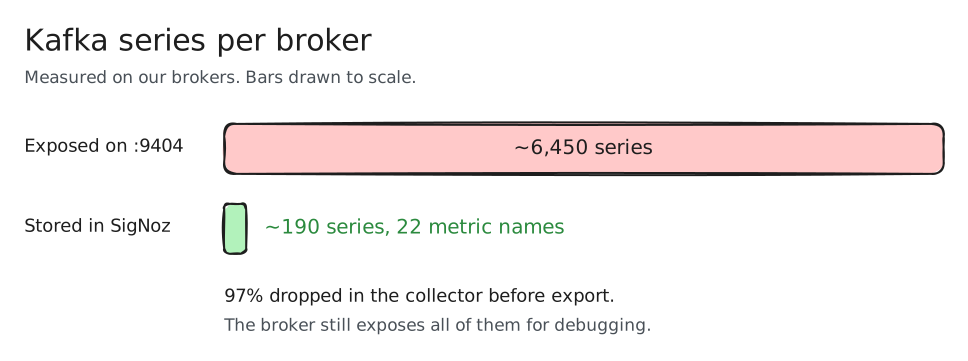
Then we looked at what the exporter serves. Each broker exposes about 6,450 kafka_* series on port 9404. (We counted 6,447 to 6,471 on a three-broker test cluster and 6,390 on a live broker.) Much of that comes from fan-out. Request metrics, for example, come per request type and per quantile, and per-partition metrics multiply with every topic.
We didn't want to store all of it. Most of it answers questions nobody was asking, and every series costs storage and query time in the backend, for every broker, forever.
So we started from the six questions and kept only what answers them, plus JVM heap and GC for broker health.
The scrape job
The collector finds broker pods through Kubernetes pod discovery. It keeps only pods that Strimzi labels as Kafka brokers, and only their tcp-prometheus port. It copies the Strimzi cluster name into a label:
receivers:
  prometheus/kafka:
    config:
      scrape_configs:
        - job_name: kafka-brokers
          scrape_interval: 30s
          kubernetes_sd_configs:
            - role: pod
              namespaces:
                names: [demo]
          relabel_configs:
            - source_labels: [__meta_kubernetes_pod_label_strimzi_io_kind]
              regex: Kafka
              action: keep
            - source_labels: [__meta_kubernetes_pod_container_port_name]
              regex: tcp-prometheus
              action: keep
            - source_labels: [__meta_kubernetes_pod_label_strimzi_io_cluster]
              target_label: kafka_cluster
The allowlist
A filter processor keeps metrics by name. Everything not on the list is dropped before it leaves the collector:
processors:
  filter/kafka:
    metrics:
      include:
        match_type: regexp
        metric_names:
          - kafka_server_replicamanager_(underreplicatedpartitions|underminisrpartitioncount|partitioncount|leadercount)
          - kafka_server_replicamanager_(isrshrinks|isrexpands)(_total)?
          - kafka_controller_kafkacontroller_(activecontrollercount|offlinepartitionscount|globalpartitioncount|activebrokercount|fencedbrokercount)
          - kafka_controller_controllerstats_uncleanleaderelections(_total)?
          - kafka_server_raftmetrics_(current_leader|current_state|current_epoch)
          - kafka_network_requestmetrics_totaltimems(_count|_sum)?
          - kafka_network_requestmetrics_(requestspersec|errorspersec)(_total)?
          - kafka_log_log_size
          - jvm_memory_(used|max)_bytes
          - jvm_gc_collection_seconds(_count|_sum)?
Request latency gets a second filter. Kafka reports totaltimems for every request type, and we only care about three:
  filter/kafka-requests:
    error_mode: ignore
    metrics:
      datapoint:
        - >-
          metric.name == "kafka_network_requestmetrics_totaltimems"
          and attributes["request"] != "Produce"
          and attributes["request"] != "FetchConsumer"
          and attributes["request"] != "FetchFollower"
That condition is folded over several lines for a dull reason: our CI lints YAML at 160 characters per line, and the one-line version was 202.
Finally, a transform processor renames the cluster label to kafka.cluster.alias, so the JMX series and the kafka_metrics series share one label and one dashboard variable filters both:
  transform/kafka:
    error_mode: ignore
    metric_statements:
      - context: datapoint
        statements:
          - set(attributes["kafka.cluster.alias"], attributes["kafka_cluster"]) where attributes["kafka_cluster"] != nil
          - delete_key(attributes, "kafka_cluster")
We validated the rendered config with otelcol-contrib validate before merging. A misspelled OTTL field and a broken regex both fail validation. So does a pipeline that names a processor that doesn't exist. That makes the check worth running in CI.
The result
After rollout we counted what reached SigNoz from the exporter: 188 series for one broker and 191 for the other, across 22 metric names. That is about 3% of what the broker exposes, a 97% cut.
There is still slack in it. Our request-type filter matches only the quantile metric name, so the totaltimems count series still come through for every request type. That is 93 of the roughly 190 series. Extending the filter to the _count and _sum names would roughly halve what's left. We haven't done it yet.
The label collision we nearly shipped
The kafka_metrics receiver has a cluster_alias setting. We set it on both receivers (one per cluster) and assumed every series would carry the alias. Our local proof of concept looked fine, but it only ran one cluster.
Right after rollout, we queried SigNoz for kafka.brokers and got one series instead of two. Its labels said which Kubernetes cluster and namespace the data came from, but not which Kafka cluster.
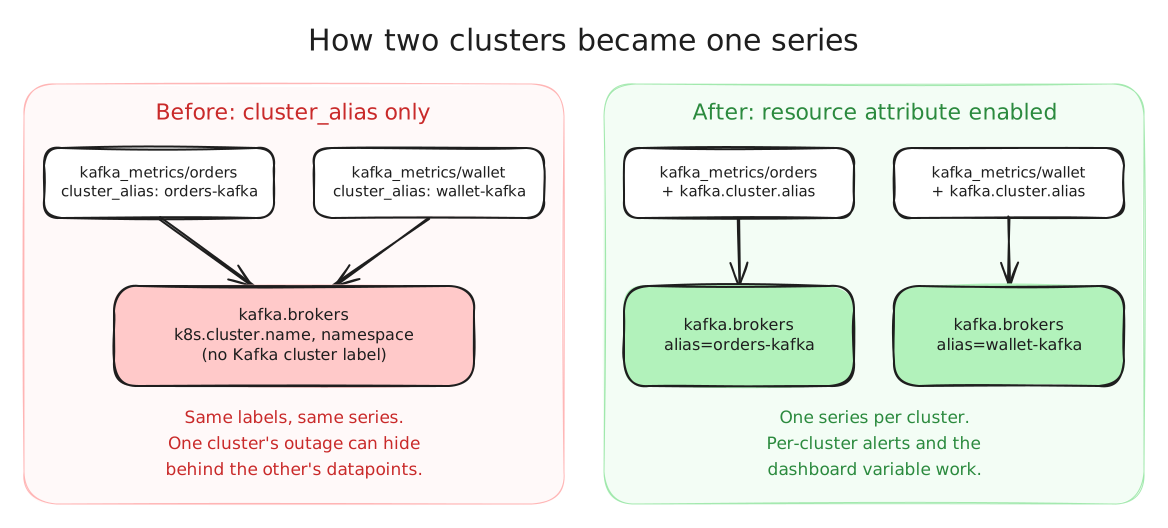
In collector 0.156.0, cluster_alias does not add the kafka.cluster.alias resource attribute by default. You have to enable the attribute explicitly:
receivers:
  kafka_metrics/orders:
    cluster_alias: orders-kafka
    brokers: [orders-kafka-kafka-bootstrap.demo.svc.cluster.local:9092]
    scrapers: [brokers, topics, consumers]
    collection_interval: 30s
    resource_attributes:
      kafka.cluster.alias:
        enabled: true
Without it, two clusters writing the same metric with the same labels land in the same series. That's worse than missing data, because it looks healthy. With one broker per cluster, kafka.brokers read 1 whichever cluster wrote last, so an outage on one cluster could have hidden behind the other cluster's datapoints.
The fix took six lines, and we confirmed the split with a second query. The lesson that generalises: when one collector scrapes several instances of anything, check that each series carries a label that tells the instances apart. A one-instance proof of concept can't catch this.
Smaller things worth knowing
A down broker produces no data, not a zero. With one broker, the receiver can't reach anything when the broker is down, so kafka.brokers simply stops. Alert on absence, not on kafka.brokers == 0. With several brokers the receiver still reaches the survivors, so the count drops instead. That case needs an "expected count" threshold too.
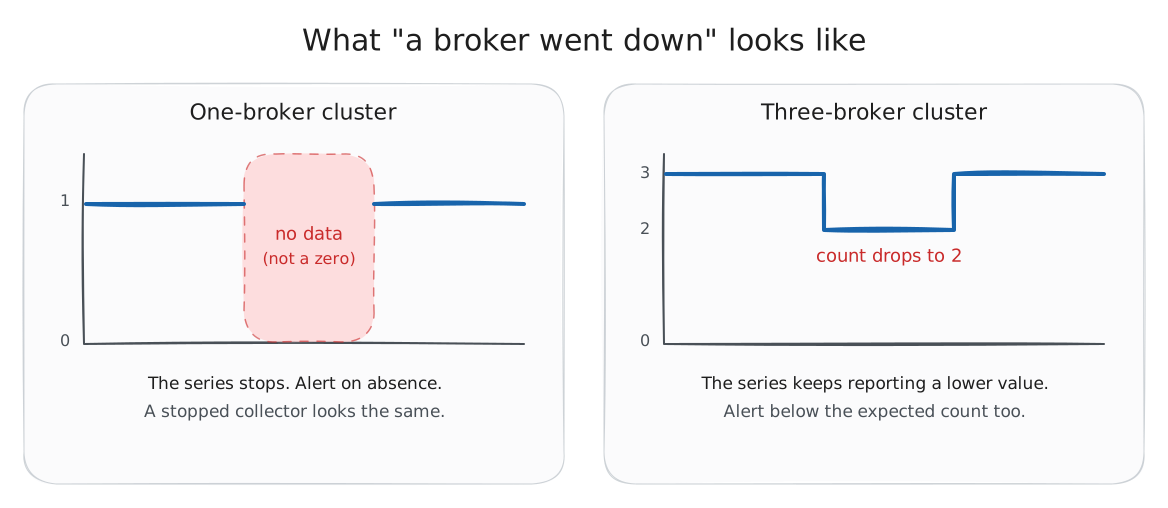
A stopped collector also produces no data. An absence alert can't tell the two apart, so look at the collector's own health and the broker pod's restarts before blaming Kafka.
Only the controller leader reports activecontrollercount = 1. Every other node reports 0. The useful check is the sum across a cluster, which should be exactly 1. Our nodes run in KRaft combined mode, so every node is a candidate. With dedicated controller nodes, the 1 comes from whichever controller node is active, so sum across the controller nodes and make sure your scrape includes them, not just the brokers. On a three-broker test cluster, killing the active controller gave 5 to 10 seconds with no controller before another broker took over. Alert windows need to be longer than that, or every failover pages someone.
Under-replicated partitions spike during restarts. On the same test cluster, killing a broker gave 25 to 28 under-replicated partitions for 20 to 25 seconds. We alert at above 0 for 5 minutes, which ignores restarts and still catches replication that stays stuck.
FetchConsumer latency is not a health signal. On our idle consumers, FetchConsumer p50 was about 500 ms and p99 about 5 seconds, while Produce p99 was 36 ms. Fetch time includes the consumer's long poll: the broker holds the request open until data arrives or the wait expires. Read latency from Produce, and from FetchFollower if you have replicas.
The first scrape after a broker restart has no Kafka series. The exporter serves only its own and JVM metrics until the Kafka MBeans register. The next scrape, 30 seconds later, is complete. That's harmless, but it confused us once.
An absence alert fires for a series that never existed. In SigNoz, a rule with "alert on absent" enters a nodata state and then fires after the absent period, whether or not the series ever had data. Create such rules after the data starts flowing, not before.
Grounding the SLIs and SLOs
We wanted SLOs we could defend. Our honest position is that we had about an hour of data from a very quiet demo: 0.02 to 0.03 messages per second per topic, and a maximum consumer lag of 2. So these are starting points, to revisit after a few weeks of real traffic.
| SLI | Definition | Proposed SLO (30 days) |
|---|---|---|
| Broker availability | Share of 1-minute windows where kafka.brokers is reported and equals the expected broker count, and the active controller count is 1 |
99.5% |
| Consumer freshness | Share of 5-minute windows where every group's lag_sum is at most 100 messages. A fixed message count only suits this traffic level; with real traffic it should become time-based lag (how many seconds behind) or a threshold scaled to throughput. |
99% |
| Produce latency | Share of 5-minute windows where Produce p99 is at most 100 ms | 99% |
| Replication health | Share of windows with zero under-replicated and zero offline partitions | 99.9% |
| Disk | Not an SLO: a capacity guard of at least 20% free, with an alert at 80% used | n/a |
A reviewer pushed on three of these definitions, and each push made the document more accurate:
- Broker availability also measures the collector. If the collector stops sending data, this SLI fails as if Kafka were down. A collector outage burns Kafka's error budget. That's acceptable if you know it and check the collector first.
- Lag is measured from committed offsets, not from finished work. A consumer that commits before processing, or commits in batches, can show low lag while work is still pending. If a group's metrics disappear entirely, the group drops out of the SLI and its lag alerts go quiet. That happens when the group is deleted, or when its offsets expire after it has been empty for
offsets.retention.minutes(7 days by default). A "no members" alert covers a consumer that stops while its offsets still exist. Treating a missing group as a failed window would close the rest of the gap. - "Can't fire" was the wrong phrase. We had written that the replication alerts can't fire on one-broker clusters. More accurately, we couldn't test those failure cases there: with one broker and replication factor 1 there was no safe way to make a partition under-replicated or offline on purpose. An offline partition can still happen, for example after a failed log directory. We tested that behaviour on a disposable three-broker cluster instead.
One more stability note from the same review. The kafka_metrics receiver is beta in 0.156.0, and every metric it emits is marked development. Names can change in a collector upgrade, so pin the collector version and recheck dashboards and alerts after upgrading.
What we would do differently
- Test with two clusters from the start. The label collision would have shown up in the proof of concept instead of in production.
- Write SLI definitions with their failure modes next to them. The review comments were all variations of "what does this number do when the thing measuring it breaks?" That question belongs in the first draft.
- Prove the absence alert end to end. Our no-data rules stayed quiet through both real broker restarts, which were shorter than the 3-minute absent window. We never stopped a broker for longer to watch the rule fire.
Takeaways
- The collector's
jmxreceiver is gone from the contrib distribution. If you run Strimzi, its Prometheus JMX exporter plus a Prometheus scrape is the shortest path, and it didn't change our broker memory. - Start from the questions you need answered and allowlist the metrics that answer them. For us that cut about 6,450 series per broker to about 190.
- When one collector scrapes several clusters, check that each series carries a label that tells the clusters apart.
cluster_aliasalone did not add one. - Decide what "down" looks like in your metrics before you write the alert. For a single broker, it's missing data.
- Put each SLI's blind spots next to its definition.