Your hardened pod can still see the host's kernel
I ran the same probe in a hardened Kubernetes pod and a Kata VM on one node. Here’s what each could see, which limits the kernel enforced, and what the VM cost to start.
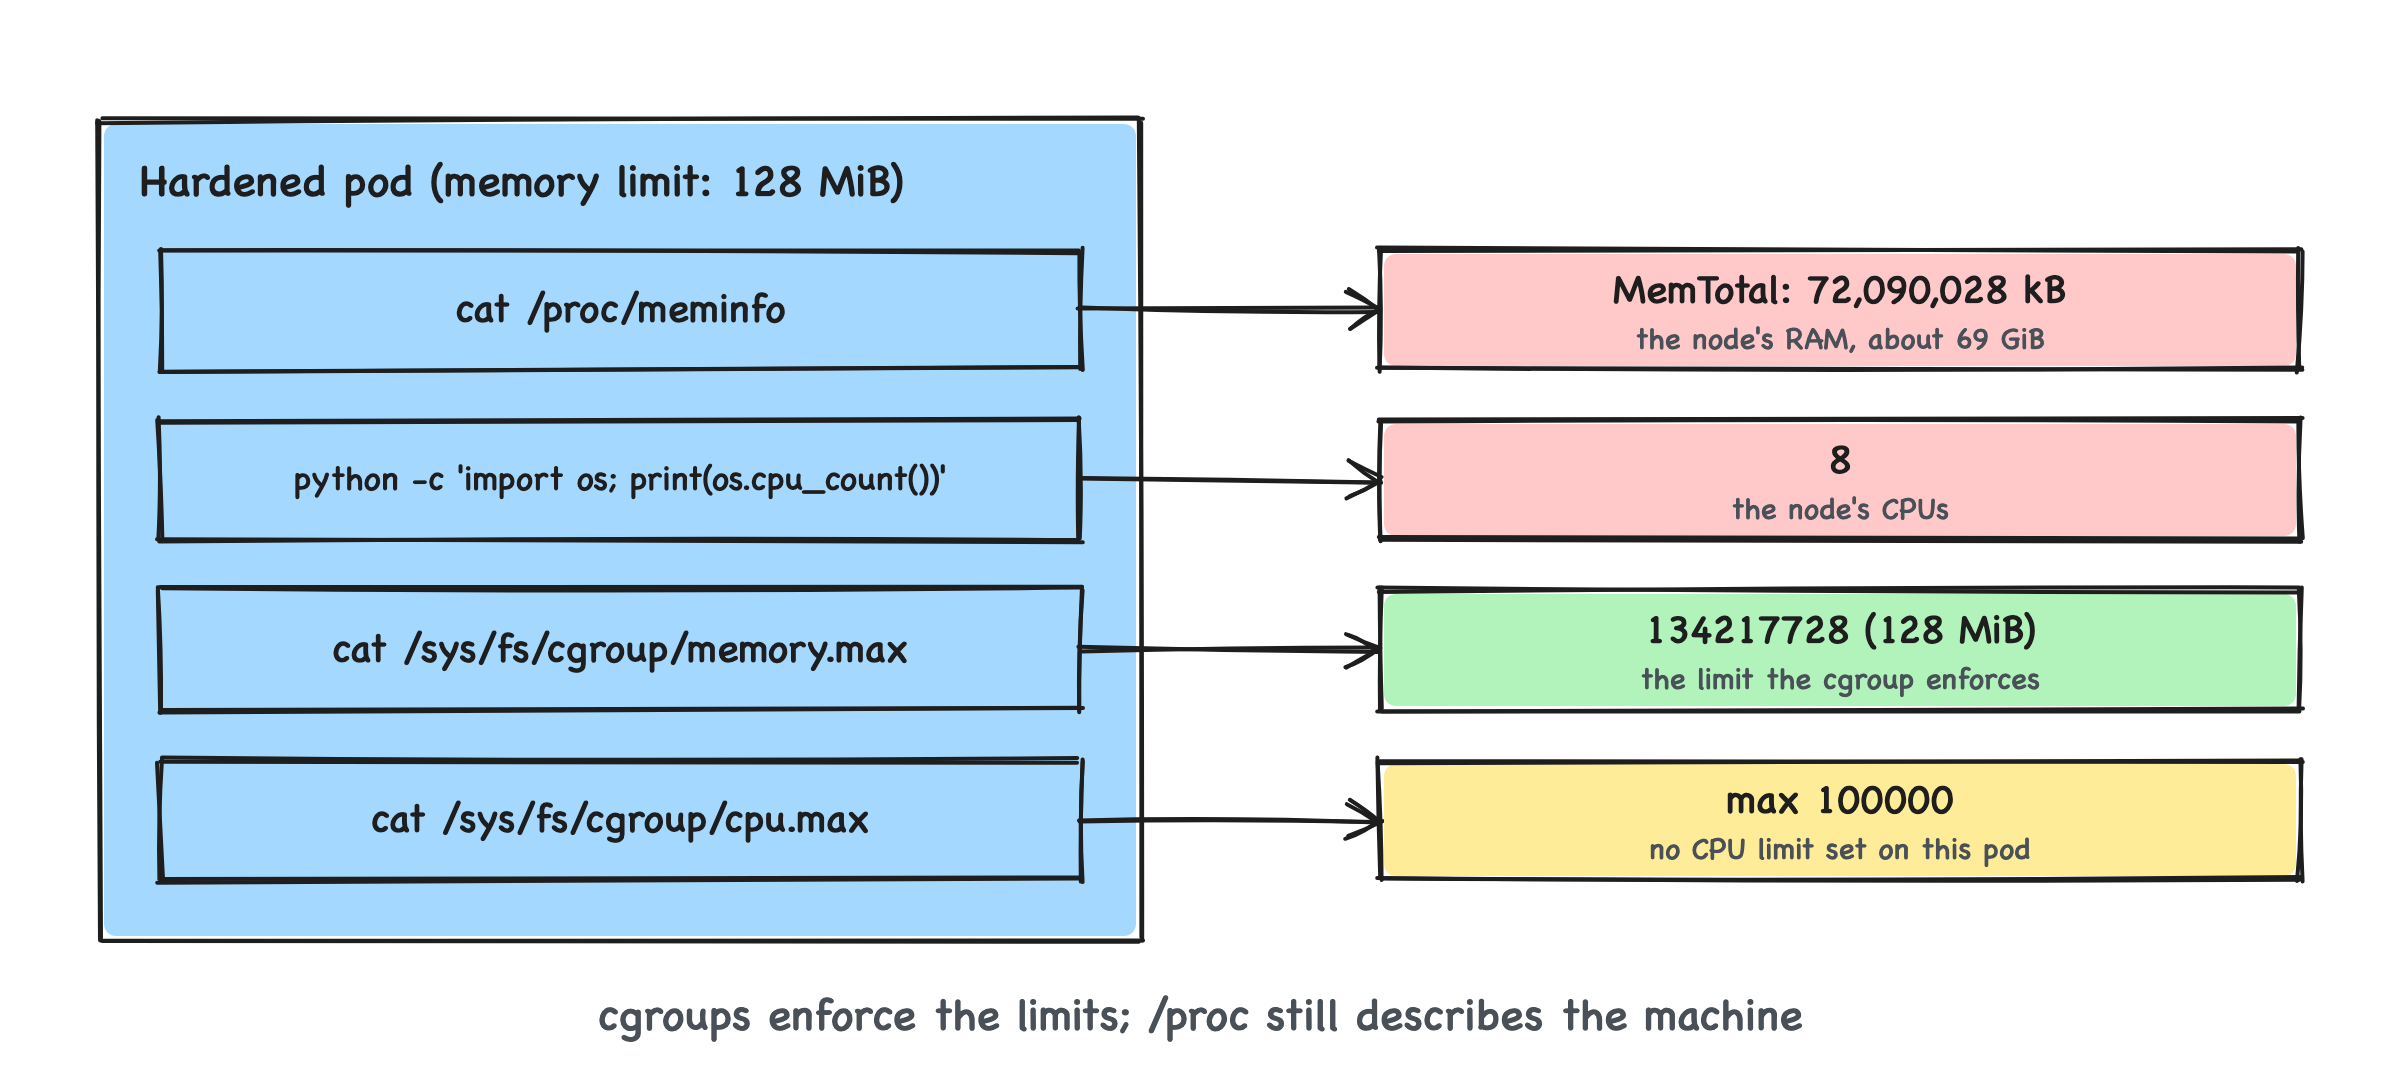
I expected the pod to see 128 MiB of memory. That was the limit I gave it.
Instead, /proc/meminfo reported about 69 GiB. The pod also saw eight CPUs, the node's kernel version and its block devices. I had removed its capabilities, made the root filesystem read-only and applied a deny-all network policy. The pod still shared the node's kernel.
I was working on a CI service that runs kustomize build on pull-request content. The input comes from whoever opens the PR. With load restrictions disabled, a kustomization can read files outside its own directory. Remote bases use the network, and --enable-helm runs the helm binary.
I wanted to know what an ordinary pod exposed before I put a VM around the build. I ran the same probe in two places on one bare-metal node: a hardened pod and a Kata Containers VM. The difference showed up in the first few lines of output.
The hardened pod
spec:
  automountServiceAccountToken: false
  securityContext:
    runAsNonRoot: true
    runAsUser: 1000
    seccompProfile:
      type: RuntimeDefault
  containers:
    - name: probe
      securityContext:
        allowPrivilegeEscalation: false
        readOnlyRootFilesystem: true
        capabilities:
          drop: [ALL]
      resources:
        requests: {cpu: 50m, memory: 64Mi}
        limits: {memory: 128Mi}
That meets the Pod Security restricted profile and goes further, with a read-only root filesystem and no service-account token. Next to it, a NetworkPolicy denies all traffic:
apiVersion: networking.k8s.io/v1
kind: NetworkPolicy
metadata:
  name: probe-deny-all
spec:
  podSelector:
    matchLabels: {app: probe}
  policyTypes: [Ingress, Egress]
User namespaces (hostUsers: false), an AppArmor or SELinux profile, and a custom seccomp profile can restrict the pod further. I kept those out of this comparison. They do not give the pod a separate kernel.
The probe
It's plain Python with only the standard library, so it runs in any image that has Python:
import ctypes, os, platform

print("kernel:", platform.release())
print("cpus:", os.cpu_count())
print("memory:", open("/proc/meminfo").readline().split(":")[1].strip())
print("disks:", " ".join(sorted(os.listdir("/sys/block"))))
print("dev:", " ".join(sorted(os.listdir("/dev"))))

libc = ctypes.CDLL(None, use_errno=True)
rc = libc.mount(b"none", b"/tmp", b"tmpfs", ctypes.c_ulong(0), None)
print("mount:", "allowed" if rc == 0 else os.strerror(ctypes.get_errno()))
The full version also tries a raw socket, DNS, the API server, the kubelet's port 10250 and an address on the internet, each with a short timeout. If you write your own, note that getaddrinfo has no timeout of its own and can hang behind a deny-all policy. Run it in a thread and give up after a few seconds.
What each pod saw
| Check | Hardened pod | Kata VM |
|---|---|---|
Kernel (uname -r) |
7.0 Ubuntu kernel, the node's | 6.18.56, Kata's guest kernel |
os.cpu_count() |
8 | 1 |
MemTotal in /proc/meminfo |
72,090,028 kB (about 69 GiB) | 969,844 kB (about 950 MiB) |
/sys/block |
dm-0 sda sdb sr0 loop0-7 |
pmem0 ram0-15 loop0-7 |
mount, raw socket |
denied | denied |
| DNS, API server, kubelet, internet | blocked | blocked |
The last two rows match, and the hardening did its job. The hardened pod's effective capability set was 0000000000000000. Neither pod could mount anything or reach the network.
The first four rows made me stop and look more closely. The hardened pod had a restricted view of processes and files, but its kernel still described the node.
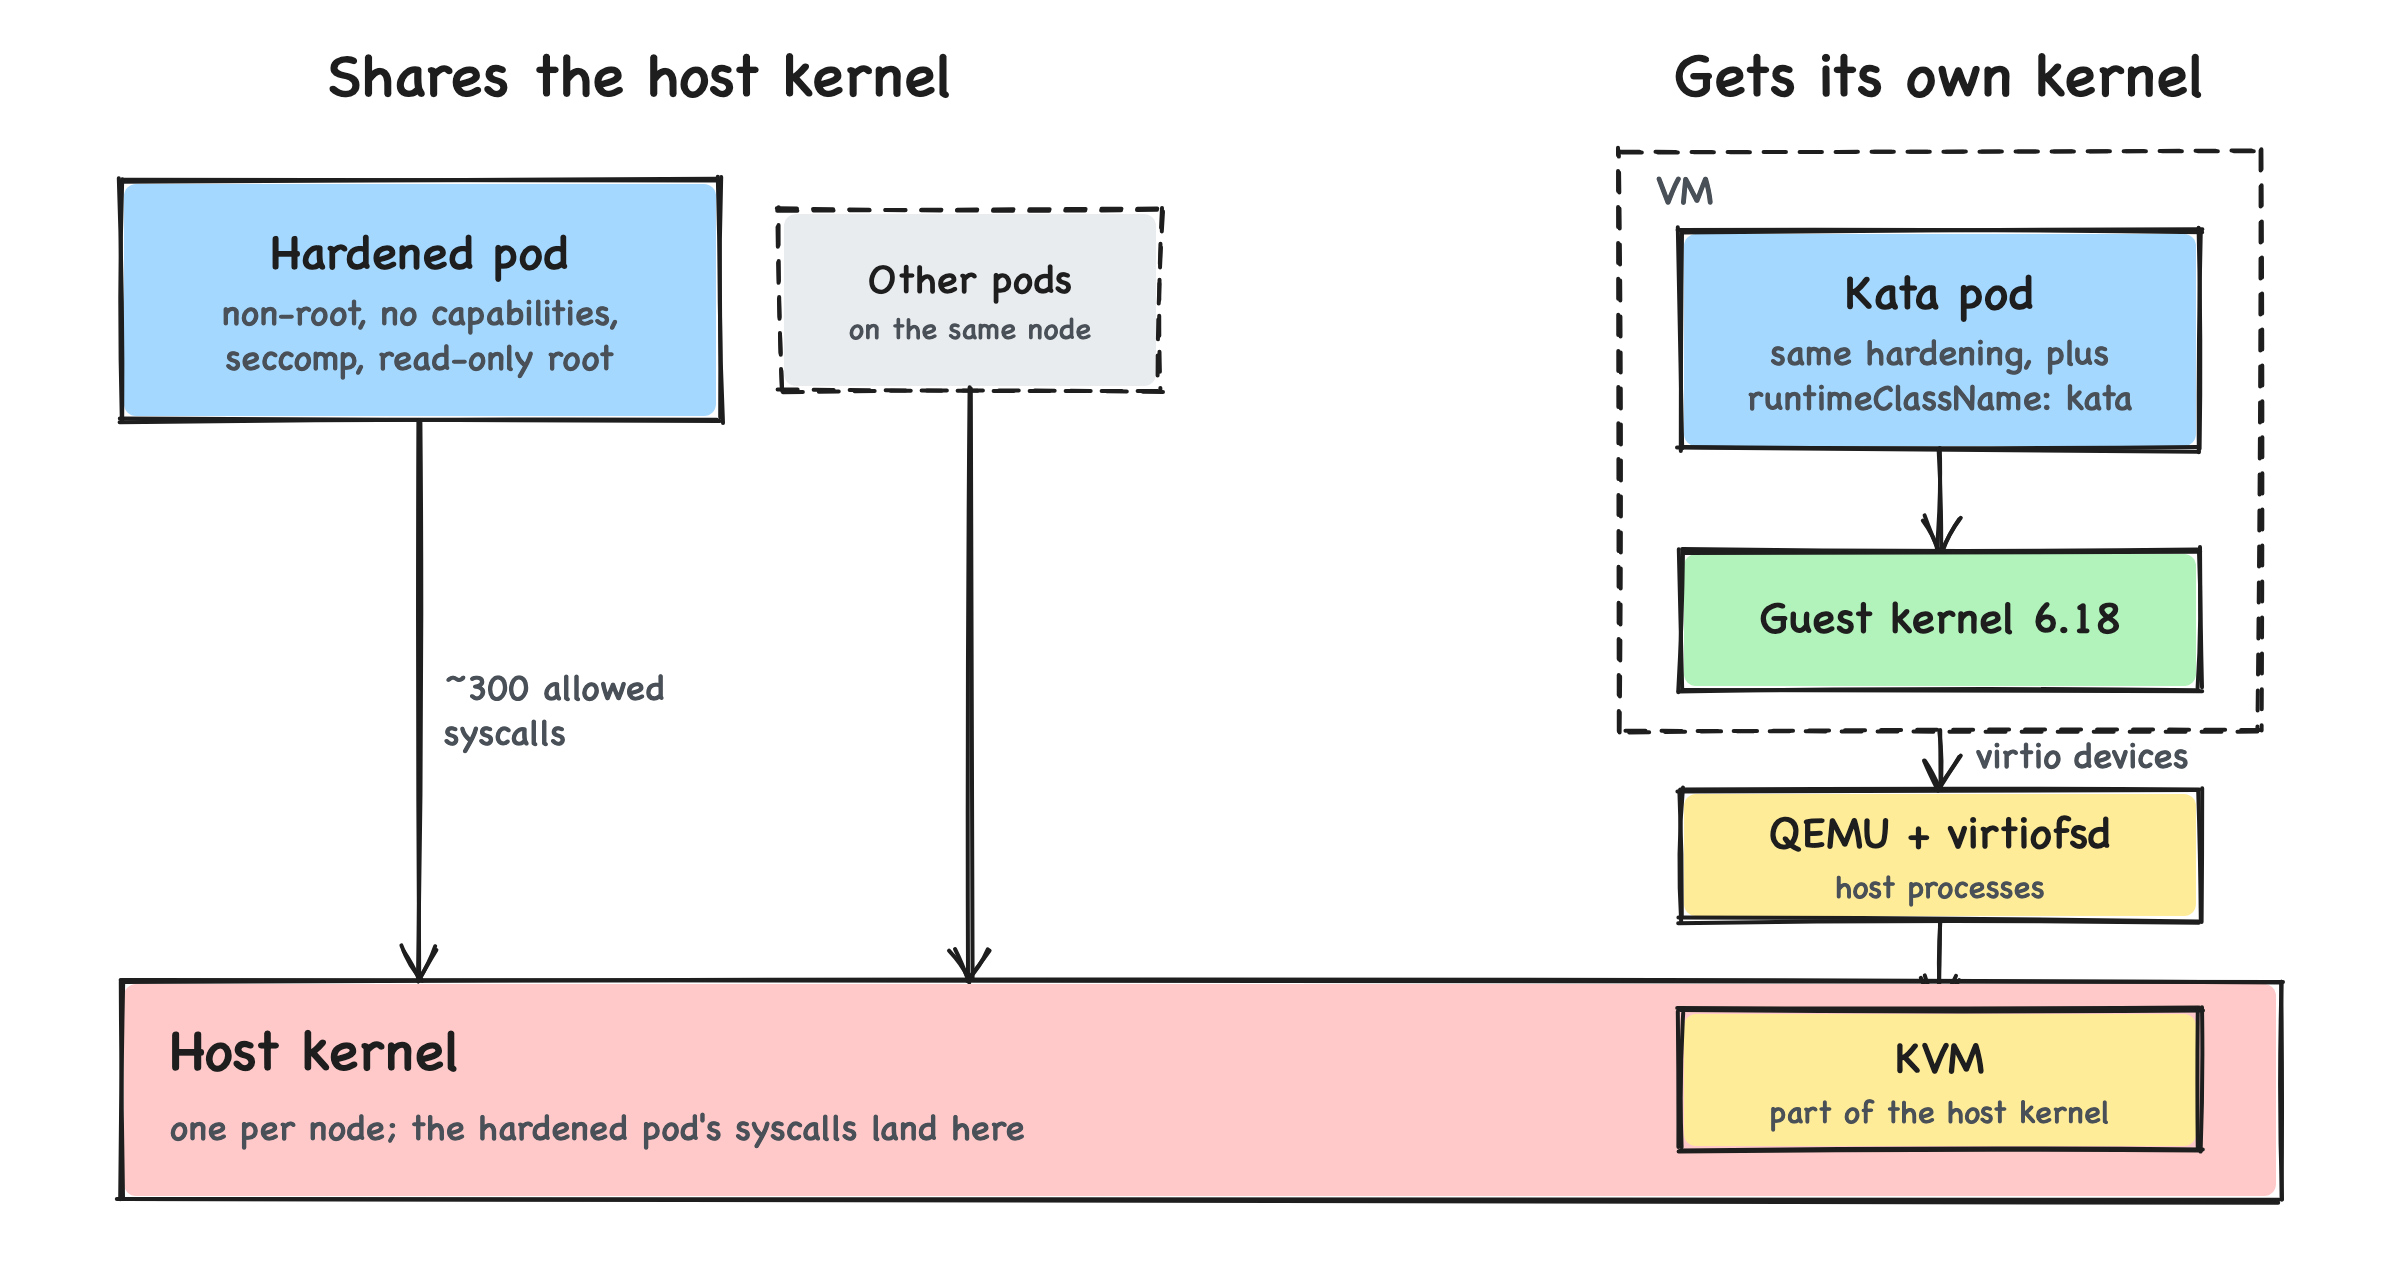
Why the hardened pod sees the host
There is one kernel per node
A container is an ordinary Linux process wrapped in namespaces. The PID namespace hid every other process on the node, so the probe saw only itself. The mount namespace gave it its own filesystem tree, and the UTS namespace its own hostname.
uname -r asks the kernel for its release, and the node has exactly one kernel. The pod reported the node's Ubuntu kernel, build string and all.
/proc reports the machine, whatever the cgroup says
The pod had a 128 MiB memory limit, and /proc/meminfo reported 69 GiB. Both are true. The cgroup enforces the 128 MiB limit. If the cgroup cannot reclaim enough memory, it can trigger an OOM kill. Meanwhile, /proc/meminfo describes the machine.
CPU works the same way. This pod had no CPU limit, so 8 is a fair answer here. Add limits.cpu: 500m and os.cpu_count() still says 8; only the cgroup's cpu.max changes.
Runtimes that size themselves from /proc get this wrong:
- JVM: it sized its default heap from host memory until container support arrived in JDK 10 (backported to 8u191). That support only understood cgroup v1. cgroup v2, the default on current distros, needs 8u372 or 11.0.16 and later.
- Go:
GOMAXPROCSonly follows the container's CPU limit since Go 1.25. - Python:
os.cpu_count()returns the node's count. 3.13 addedos.process_cpu_count(), which respects CPU affinity but not cgroup quota.
If your code sizes thread pools or caches, read /sys/fs/cgroup/memory.max and /sys/fs/cgroup/cpu.max (cgroup v2). LXCFS can make /proc report the limits, but few clusters run it.
sysfs lists the host's disks
/sys/block listed dm-0, sda, sdb and sr0, the node's real block devices. sysfs isn't namespaced for block devices, so the pod can read whatever sysfs says about them.
It can't open them. The device cgroup only allows the standard set of devices (null, zero, random, pts and the rest), the pod's /dev has no sda node, and without CAP_MKNOD it can't create one. It's still a free map of the host for anyone who gets code running in the pod.
Seccomp leaves about 300 syscalls open
RuntimeDefault is the container runtime's default seccomp profile. Docker's documented default profile blocks around 44 syscalls. The exact profile depends on the container runtime and its version. Some of the allowed ones are gated on capabilities, so dropping ALL closes a few more. That still leaves a couple of hundred syscalls, each running in the host kernel with the pod's arguments.
That's why Dirty Pipe (CVE-2022-0847) was bad for containers. It let an unprivileged process overwrite the page cache of files it could only read, using pipe() and splice(). The example matters because ordinary application syscalls can expose kernel bugs. A non-root user, zero capabilities and a read-only root filesystem did not prevent Dirty Pipe on vulnerable kernels.
This changed how I thought about the CI service. The pod restrictions reduced what a build could do, but the remaining syscalls still reached the node's kernel. I was less comfortable with that boundary for PR content from strangers.
What changes inside the Kata VM
Kata Containers runs each pod inside a lightweight VM on KVM. The pod spec barely changes: add runtimeClassName: kata, and the container runs on a guest kernel that Kata ships.
What the probe saw:
- Kernel:
6.18.56, Kata's guest kernel. - CPU and memory: 1 vCPU and about 950 MiB, the VM's virtual hardware.
- Disks:
pmem0is Kata's guest OS image, attached as an emulated NVDIMM.ram0toram15are the guest kernel's RAM disks; thebrddriver creates 16 by default. None of the node's disks appear.
A successful guest-kernel exploit can compromise the VM. That VM holds the kata-agent, this pod's files (shared in through virtiofs), any secrets mounted into the pod and the pod's own network access. It doesn't hold the node or the other pods.
Reaching the node takes a second bug, in QEMU (Kata also supports Cloud Hypervisor and Firecracker), in virtiofsd or in KVM. QEMU and virtiofsd are host processes that make their own syscalls, so they're attack surface too. The VM boundary adds isolation, but QEMU, virtiofsd and KVM remain part of the attack surface.
What the VM costs
These numbers are from the same node, three runs each:
| Hardened pod | Kata VM | |
|---|---|---|
| Cold start, request to ready | normal pod start | 9.5 s median |
| Start from a pre-warmed pool | n/a | 0.07 s |
| Fixed overhead per pod | none | 250m CPU, 320 MiB (the RuntimeClass overhead) |
| Needs | nothing extra | /dev/kvm on the node |
The KVM requirement rules out many cloud instance types unless they offer nested virtualisation or bare metal. One of my own machines failed it because virtualisation was switched off in its BIOS.
gVisor is the other common answer: it runs the pod on a user-space kernel and needs no KVM. I couldn't use it, because gVisor's CRI-O guide lists CRI-O 1.37 as the minimum and my nodes run an older version.
The network was open for the first few seconds
My first run reported DNS, the API server and the internet as reachable from the hardened pod, despite the deny-all policy.
The policy was fine. Kubernetes leaves the timing of NetworkPolicy enforcement to the network plugin. In my cluster, the CNI applied it a moment after the pod started, and the probe ran in that gap.
For the probe, I waited before running the network checks. That made the result useful, but a sleep does not close the startup gap for untrusted code. Enforcement before workload startup depends on the CNI and its configuration. I would check that behavior for the cluster before relying on the policy.
Where I landed
I still use hardened pods for workloads where I trust the code and its input. The restrictions matter. In this test, they stopped the mount and raw socket attempts, and the network policy blocked the connections once it took effect.
For the CI builds, the input comes from a PR. I chose to put a VM around the build as well. The cold start was expensive on this node, but the warm pool brought the observed start time down to 0.07 s.
The result that stayed with me was that 128 MiB limit beside a 69 GiB MemTotal. The limit worked. It was the view from inside the pod that surprised me.